New Welfarism and the Child in India: New Evidence from the NFHS
1.Introduction
The recently released fifth round of the National Family Health Survey (NFHS-5) provides reliable and independent evidence to assess the micro-development performance of this government before Covid-19 struck. The survey covers many dimensions of health, nutrition, and overall quality of lives.
This piece focusses on two of those dimensions: the government’s consciously distinctive approach to redistribution and inclusion that we call New Welfarism and the other relating to the situation of the child in India. The contrast in performance on these dimensions offers potentially important lessons for the political economy of policy-making.
Before discussing the findings, several caveats need emphasis.
- Since the latest round only has data for 17 states and 5 Union Territories, our findings cover only 54 percent of India’s population. Madhya Pradesh, Uttar Pradesh, Punjab, Rajasthan and Tamil Nadu are notable exclusions.
- Our findings cover only some government programs which targeted the provision of women’s bank accounts, electricity, sanitation, and cooking fuel, respectively. They do not cover housing for lack of data.
- Even where data are available, they may not capture the granularity of the outcome. For example, “access to power” does not mean families have 24×7 power from the grid; “access to cooking gas” is no guarantee of its daily use.
- Even though the New Welfarism was a central government initiative, significant state-level variations suggest that the center can neither take full credit nor bear all the blame for outcomes. This is especially true of the child indicators which are critically influenced by state implementation capacity.
2.New Welfarism
The New Welfarism of the Narendra Modi government represents a very distinctive approach to redistribution and inclusion. It does not prioritize the supply of public goods such as basic health and primary education as governments have done around the world historically; it is also somewhat ambivalent about strengthening the safety net which past Indian governments have pursued with mixed success. Instead, it has entailed the subsidized public provision of essential goods and services, normally provided by the private sector, such as bank accounts, cooking gas, toilets, electricity, housing, and more recently water and also plain cash.
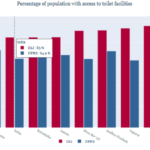
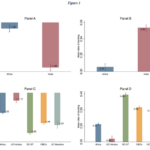
Figure 1 illustrates the performance in relation to the New Welfarism.
First, major progress has been made by this government in achieving its New Welfarism. By 2019, 72 percent of all women had bank or savings accounts that they report as being able to use themselves, 98 percent of all households had access to electricity, nearly 70 percent to improved sanitation, and 60 percent to clean cooking fuel.
Second, the pace of improvement, measured as the percent of households that have gained access to these goods and services each year, has accelerated since 2015 (the lines tilt more sharply upwards). Improvement has been especially marked in rural India.
Third, performance on some metrics falls short of earlier claims. The clearest example is sanitation: the India-wide average of access to clean sanitation is still a little under 70 percent, far from the declaration that India is 100 percent open-defecation free. The Bihar number is only 49 percent.
Figure 1. Access to essential services (% of households)


Notes: All the numbers are percent of households that have access to the good/service in question. Red, green, and blue refer to data for rural, urban and all households, respectively. Data are for the 5 years ending in the year labelled on the x-axis, with data for other years linearly interpolated. Data are for 15 states for which numbers are available for all the rounds of the NFHS. Data for women’s bank/savings accounts—available only after 2005—capture financial inclusion and women’s empowerment because they are accounts that women themselves use. Numbers in the charts are the percentage point changes per year of access to households before (black) and after (blue) 2015.
The following are specific details about changes in these indicators pre and post 2015.
- Perhaps, the most striking change relates to women’s financial inclusion and empowerment. Every year, pre-2015, an additional 1.5 percent of women in rural areas were acquiring bank or savings accounts that they could themselves use. Post-2015, this rose to 7.1 percent, a near 5-fold increase. In rural Bihar, the number of women with accounts jumped from 6.6 percent in 2005 to 25 percent in 2015 to almost 50 percent in 2019.
- Post-2015, 3.4 percent of households were gaining access to better sanitation, compared to 1.5 percent before.
- For cleaner cooking fuels, the pace increased seven-fold to 5.6 percent of households every year after 2015.
- In rural electricity, 2 percent of additional households were getting power every year pre-2015, and the pace increased to 3.4 percent of households every year.
3.Health and Nutrition of the Child
Next, we provide preliminary evidence on the health and nutrition of the child in India.
The NFHS has 42 indicators related to the child’s health and nutrition (there is one indicator on school enrollment which falls outside the scope of this analysis). Indicators fall into 9 categories and each of these can be divided into outcomes and inputs as the Table shows. For example, neonatal, infant and under-5 mortality rates can be thought of as outcomes. Similarly, all the nutrition indicators—stunting, wastage, excess wastage, under-weight and over-weight—as well as the prevalence of diarrhea, acute respiratory illness (ARI) and anemia can also be classified as outcomes.
In contrast, the post-natal care indicators relating to visits made by health workers, the provision of vaccinations and Vitamin A, and the extent and nature of feeding for the child can be classified as inputs (the Appendix provides details of the questions asked in the NFHS).
Table. Nature and Number of Child Health Indicators in NFHS

The input indicators are not easy to aggregate in easy or obvious ways, so we leave that as material for future research. Instead, we present some findings on the 11 child outcomes below. First, though, some nuances. We score wasting (weight for height of children) as an improvement because even though the gains were marginal, they reversed a negative trend between 2005 and 2015.
However, the wasting outcome must be treated with caution because trends on wasting move contrary to those of “severe wasting” even from 2005. There is also one indictor we have ignored, since it is difficult to classify: underweight, where there were marginal gains, but a slowdown relative to the past.
Now, for the results, which can be summarized as: India continues to be successful in preventing child deaths but the health and nutrition of the surviving, living child has deteriorated, somewhat worryingly.
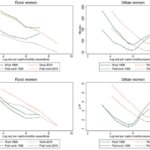
Of the 10 outcomes, there have been improvements in 4 (Figure 2). It is readily apparent that India continued to make progress in preventing child-related deaths (neonatal, infants and under-5). That said, the pace of improvement in child mortality slowed down relative to the previous ten years. For example, between 2005 and 2015 the infant mortality rate came down by nearly 2 percentage points per year while between 2015 and 2019 that pace halved to 1 percentage point per year (post-2015, the mortality lines are flatter than before in Figure 2). Whether some slowing should be expected because India is now close enough to the desirable benchmark is an open question.
Figure 2.Outcomes Showing Improvement (Percent of children; scales inverted) IMR and U5MR are infant and under- 5 mortality rates, respectively
Figure 3 shows the 6 indicators where outcomes have deteriorated. These all relate to what happens after survival: the health (anemia, diarrhea, and acute respiratory illness (ARI)) and nutrition (stunting, and over-weight) of the child deteriorated between 2015 and 2019. In none of these cases is the aggregate deterioration driven by outliers, that is, by one or two states.
Moreover, the absolute deterioration in health and nutrition indicators must be seen against the fact that they reversed historic trends of steady improvements. That is particularly true of the prevalence of diarrhea and anemia and to a lesser extent of stunting and acute respiratory illness (post-2015, the lines slope downwards whereas they sloped upwards from 2005-2015).
Figure 3. Outcomes Showing Deterioration (Percent of children; scales inverted) ARI is acute respiratory illness; stunting and severe wasting relate to children under 5 years
We mentioned earlier that the NFHS provides data on child-related inputs. These need to be examined too. Suppose it turns out that the center and the states have done a good job in improving the quality and quantity of inputs that go into the child, then there would be a real puzzle: why do outcomes and inputs diverge? Indeed, as we showed in our earlier piece, the government has made great strides in providing a number of basic needs to households such as toilets, clean cooking fuel, power and bank accounts. Those developments would also serve to aggravate the puzzle of why the health and nutrition of the child in India has deteriorated.
As discussed in Chapter 5 of the Economic Surveyof 2015-16, perhaps the next big welfare initiative of the government, building on the considerable success of its New Welfarism, should be a mission-mode focus on the well-being of the early child (and of course mother), from the womb to the first 5 years, which research shows is critical for realizing its long run potential as an individual.
Understanding the Difference
What might explain the difference between the success of New Welfarism and the weaker performance in relation to the health and nutrition of the child?
The New Welfarism embodies a vision, both imbued with conviction and laden with calculation. The conviction is that providing these goods and services will make a critical difference to the lives of the poor. Indeed, the New Welfarism recalls the Basic Needs approach to development that was in intellectual vogue several decades ago. The conviction also stems from a belief that the power of technology can be harnessed to achieve successful implementation.
New Welfarism’s calculation is that there is rich electoral opportunity in providing tangible goods and services, which are relatively straightforward to deliver, measure, and monitor. Traditional government services such as primary education are intangible, which are difficult even to define, much less measure. But when the government promises toilets, for example, everyone can monitor progress. Either a toilet has been installed, or it has not.
Opportunity is also spotted in providing benefits that can be delivered in the political present as opposed to intangibles that might accrue at some more distant point in time. Critical to exploiting that opportunity is ensuring that deliverables can be attributed to the Union government. To this end, the central implementation machinery (bureaucracy and banks) is deployed as much as possible. And to erase any doubt about the source of the benefits, the policy is backed-up by strong and persistent messaging, highlighting the achievements and the benefactor.
In contrast, improving child nutrition and health is precisely the sort of intangible benefit that is difficult to achieve, measure, or monitor. Households cannot easily see whether and to what extent better nutrition has been provided; its benefits, embodied in happier, healthier, and cognitively stronger children, are even less clearly discernible. Moreover, better nutrition takes time and patience to deliver. And, many factors beyond state-directed efforts are necessary for proper nutrition. In particular, families need a broader macro-economic environment of robust growth of income, purchasing power and consumption.
So, two conclusions might be drawn from this tale of two outcomes. First, governments need visions, both substantive and political. Second, some outcomes require direct, relatively easy action (like delivering tangible goods and services) but others will be more difficult, requiring above all a dynamic economy, and a conception of the policies and institutions that will support it.
In some ways, this Indian experience is consistent with a broader global trend (Poland, Hungary and Turkey). Even without delivering broad-based prosperity, populist leaders and parties are finding electoral success through a potent, new cocktail: leveraging the identity politics of the right, embracing tepidly, even rejecting, the market-focused neo-liberalism of the center, and appropriating the redistributive economics of the left. Except that in India today, traditional redistribution (strong safety nets or improved public good provision) has ceded to a distinctive New Welfarism, where the central government is demonstrably and effectively providing tangible essentials to its citizens.
Appendix


This narrative is based on two articles published in the Indian Express, on 22nd December 2020 (8:58:23 AM) and 6th January 2021 (9:04:18 AM) respectively.


