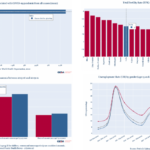
India’s agricultural goods trade, 2013-2022
While cereals, particularly rice, comprise the bulk of the Indian exports of agricultural goods, edible oils comprise the dominant share of agricultural imports
India’s global trade in agricultural commodities has seen significant variations in the past decade. From being a net exporter of agricultural products in 2013 and 2014, India’s imports saw a significant increase in subsequent years when it became a net importer of agricultural products. The trend reversed in 2020, and exports have exceeded imports ever since.
In this analysis, we look at trends in India’s exports and imports of cereals, pulses, oilseeds, fruits, vegetables and edible oils between 2013 and 2022. The analysis is based on data from the Food and Agriculture Organization (FAO).
India exported 390.7 lakh tonnes of agricultural commodities, encompassing cereals, pulses, vegetables, fruits, oilseeds, and edible oils, while importing 198.1 lakh tonnes in 2022, the most recent year for which FAO data is available. The major contributors to exports were cereals, especially rice, wheat, and maize, along with vegetables, whereas imports were led by edible oils, pulses, and fruits.
Between 2013 and 2022, India’s exports of agricultural commodities grew at a compounded annual growth rate (CAGR) of 3.7 percent. In absolute terms, cereals, particularly rice, have positioned India as a net exporter of the agricultural commodities. In the same period, the quantity of rice exported saw a CAGR of 7.7 percent, the highest among all agricultural commodities. By 2022, India was exporting an unprecedented 222.4 million tonnes of rice to other countries, almost 57 percent of total agricultural exports. Vegetables had the second-highest share in exports after cereals in absolute terms, amounting to 29.3 lakh tonnes, up from 23 lakh tonnes in 2013.
Along with rice, pulses, too, saw a CAGR of 7.7 percent in the 2013-2022 period, though in absolute terms, the quantity of pulses exported was relatively smaller (8.2 lakh tonnes in 2022). Fruit exports grew at a CAGR of 5.6 percent between 2013 and 2022, increasing from 8.7 lakh tonnes to 14.3 lakh tonnes in the period.
On the other hand, the exported quantity of maize (corn) and edible oils saw a negative CAGR between 2013 and 2022. While India exported 47.5 lakh tonnes of maize (corn) in 2013, this quantity saw a decline in subsequent years before picking up again in 2021 and 2022. In 2022, India exported 34.9 lakh tonnes of maize. Oilseeds’ exports also registered a negative CAGR in this period.
When it comes to imports, it is edible oils that constitute the bulk of agricultural imports in India, and this share has seen a growth in recent years. In 2013, India imported 109.6 lakh tonnes of edible oils, comprising 72.4 percent of all agricultural imports. By 2022, this had increased to 152.8 lakh tonnes and 77.1 percent of all agricultural imports. Further, within edible oils, palm oil accounted for 60 percent of all imports. It was followed by soybean oil (25.6 percent) and sunflower oil (12.5 percent), collectively making up almost 98 percent of the edible oil imports.
After edible oils, pulses contribute the next big share of agricultural imports (12.2 percent in 2022). Imports of pulses experienced a surge from 33.3 lakh tonnes in 2013 to 70 lakh tonnes in 2017, followed by a substantial decrease to 24.2 lakh tonnes in 2022. Improved production, procurement and price support and import restrictions contributed to this decline (Commission for Agricultural Costs and Prices, 2023). During 2017-2022, the share of peas and chickpeas in the pulses import basket declined significantly, while the share of pigeon peas increased notably. In 2017, peas and chickpeas held almost two-thirds of the total pulses’ imports, which gradually decreased to just 3.5 percent by 2022, when beans, lentils, and pigeon peas constituted over 90 percent of the total pulses’ imports.
If you wish to republish this article or use an extract or chart, please read CEDA’s republishing guidelines.


