Picture This: Covid vaccination leaving women behind
India’s Covid vaccination program has faced criticism for the slow pace of vaccination and for its digital portal. Previously, we had taken a look at the slowing pace of Covid vaccinations in the country in a Picture This post.
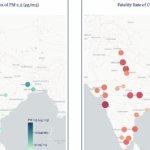
The map above highlights another gap in India’s Covid vaccination program, and this is related to gender. It highlights districts across India based on female-to-male vaccination ratio on a cumulative basis.
The slider on the left allows us to slide to any date between 16 January 2021 and 3 June 2021. If we hover over any district in the map after that, it will reveal the female-to-male ratio for Covid vaccination for that district. For example, if we slide to 31 May 2021 in the slider, and hover over Thane in Maharashtra, we see a figure of 0.85, which means 85 women have been vaccinated in Thane district per 100 men till 31 May 2021. This shows that 14 fewer women received vaccine doses in the district, pointing to a gender gap.
Till 3 June 2021, the ratio for India came out to be 0.90, which means that only 90 women received Covid vaccine doses for every 100 men vaccinated. This points to a sharp gender gap in India’s Covid vaccination program.
The vaccination program was opened in phases. Phase 1 began on 16 January 2021 and covered all healthcare workers and frontline workers, a large proportion of whom were women. Phase 2 began on 1 March 2021 and included all those above 60 years in age or those older than 45 but with comorbidities. On 1 April 2021, phase 3 threw open vaccinations to all those aged more than 45, while all adults became eligible for vaccination in phase 4, starting 1 May 2021.
We see that as vaccination has opened up to the larger sections of the general public, the ratio has declined. In other words, the ratio in the first phase was high because women formed a high proportion of frontline health workers. As citizens are voluntarily getting vaccinated, women are falling behind, which is a matter of concern.
Female to male vaccination ratios across states at different points in time can be accessed here.
If you wish to republish this article or use an extract or chart, please read CEDA’s republishing guidelines.
