Understand Global Hunger Index
The Global Hunger Index was in news in India recently as the country was ranked 101 out of 116 countries in the 2021 index. With a score of 27.5, the index classifies the hunger situation in India as ‘serious’. India was ranked 94 out of 101 countries in 2020. But what does the Global Hunger Index score and ranking signify? And what does this fall in India’s ranking suggest?
Global Hunger Index
The Global Hunger Index measures and tracks hunger at the global, regional, and national levels. It uses data from various US and other multilateral agencies to compute scores for all the countries. The GHI is comprised of four indicators across three dimensions. These are:
Dimensions:
- Child mortality
- Under-five mortality rate is the indicator used to calculate the score for this dimension
- Inadequate food supply
- Undernourishment is the indicator used to calculate the score for this dimension. Undernourishment score refers to the population whose caloric intake is insufficient (and hence considered undernourished)
- Child undernutrition
- Child wasting – the share of children (age < 5) who have a low weight for their height
- Child stunting – the share of children (age < 5) who have a low height for their age
Data sources
The 2021 GHI uses the average of data from 2018 to 2020 from FAO to calculate the proportion of undernourished people in a country. It uses the latest available data from 2016 to 2020 from UNICEF on child wasting and child stunting and takes the data on child mortality for the year 2019 from UN IGME.
India and the GHI
India’s score of 27.5 in the 2021 GHI is the second worst among all SAARC countries with only war-torn Afghanistan scoring higher at 28.3. Pakistan’s score is 24.7, while Bangladesh, Nepal, and Sri Lanka have scores of 19.1, 19.1, and 16.0 respectively.
Figure 1 shows GHI scores in the years 2000, 2006, 2012 and 2021 for India, Bangladesh, Pakistan, and Sri Lanka.
Figure 1
While India’s rank is 101, Afghanistan is at 103 while Pakistan, Bangladesh, Nepal, and Sri Lanka are ranked 92, 76, 76, and 65 respectively.
For India, the underlying data for GHI shows a deteriorating situation in terms of proportion of population undernourished and prevalence of wasting in children aged less than five. The GHI data shows that the proportion of undernourished population in India stood at 19.6 percent between 2005 and 2007 (data used to calculate 2006 GHI scores). This improved to 15 percent between 2011 and 2013 (data used to calculate 2012 GHI scores). This has now declined to 15.3 percent between 2018-20, thereby affecting India’s score negatively.
Similarly, prevalence of child wasting (age < 5 years) had decreased from 20 percent (2004-08) to 15.1 percent (2010-14) but has now increased to 17.3 percent (2016-20). This has also affected India’s score negatively. Incidentally, India has the highest prevalence of child wasting in the world.
On the other hand, prevalence of child stunting has decreased from 38.7 (2010-14) to 34.7 (2016-20) although it remains very high. Similarly, under-five child mortality has decreased from 7.1 in 2006 to 5.2 in 2012, and 3.4 in 2019.
Figure 2 juxtaposes India’s GHI scores in the years 2000, 2006, 2012, and 2021 with per capita GDP growth (constant prices, 2011-12). For the year 2000, we have used the growth rate between 1994 and 2000, For 2006, we have used the growth rate between 2000 and 2006, and so on.
The GDP growth rate in the year 2000 (over 1994) was 4.34 percent while India’s GHI score was 38.8. The growth rate increased to 5.43 percent in 2006 as the GHI score decreased to 37.4. In 2012, the GDP growth rate increased further to 5.69 percent and the GHI dropped to 28.8. However, in 2021, the GDP growth rate (over 2012) has declined to 3.69 percent while the GHI has also declined to 27.5. Thus, the period between 2006 and 2012, which recorded the sharpest decline in India’s GHI score coincided with the fastest growth in India’s per capita income.
Figure 2
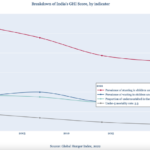
Figure 3 shows the trend for GHI indicators for India between 2000 and 2021.
Figure 3
Despite the overall decrease in child stunting, it continues to remain high in India on an absolute scale. In a data narrative, Ashwini Deshpande and Rajesh Ramachandran wrote about the “Indian Enigma” wherein Indian children are shorter than their counterparts in sub-Saharan Africa despite India being a richer country.
On the GHI severity scale, a score of less than 10 means a country’s hunger situation is considered low, a score of 10 to 19.9 signifies a moderate hunger situation, a score of 20 to 34.9 underlines a serious hunger situation, a score of 35 – 49.9 shows an alarming situation, while a score of 50 or more is considered extremely alarming. Thus, with a score of 27.5, India finds itself clubbed with countries where the hunger situation is considered serious.
With high prevalence of child stunting, child wasting, and increase in prevalence of undernourishment it is no surprise that India’s scores high on the Global Hunger Index and is ranked as low as 101 out of 116 countries in 2021.
Did Covid affect 2021 GHI scores?
As explained earlier, the data for calculating 2021 GHI scores do not always include data from the year 2020. Therefore, while for some countries, the scores may be affected by the spread of the Covid-19 pandemic in the year 2020, a full accounting of its impact may only happen in subsequent years.
Comparing GHI scores and ranks over years
GHI methodology has been revised over time, making comparisons misleading. For example, child stunting and wasting data was included in 2015 and thus led to a shift in GHI scores. However, that doesn’t mean GHI scores cannot be compared to previous years. Each GHI report includes three reference years for comparison. The 2021 GHI includes the years 2000, 2006, and 2012 for reference. We are aware that GHI score for a year are based on underlying data from a range of years. These reference years are selected to ensure there is no overlap of years and therefore data between those years.
For example, India had a score of 38.8 in the year 2000 which improved to 37.4 in the year 2006, 28.8 in the year 2012 and stands at 27.5 in 2021. Thus, India’s score has declined by 29.1 percent since the year 2000 showing an improvement in the hunger situation in the country. In the same period Pakistan’s score has improved by 32.7 percent, Sri Lanka’s by 26.9 percent, and Bangladesh’s by 43.8 percent.
Computing the GHI score
Each country’s score across all the four indicators is calculated using certain thresholds. For example, the highest country-level value observed for undernourishment since 1988 is 76.5. So, undernourishment’s threshold has been kept at 80. If a country’s undernourishment prevalence is 40 percent in a particular year, its undernourishment score in that year will be 50 (on a scale 1-100). The thresholds for child stunting, child wasting, and child mortality have been kept at 70, 30, and 35. Once the score for each indicator is computed, the country’s GHI score is calculated.
1/3 score on child mortality + 1/3 score on undernourishment + 1/6 score on child wasting + 1/6 score on child stunting = GHI score
0 is considered the best score on the GHI and 100 the worst. A value of 0 would mean the country has zero undernourished people, zero children who are wasted or stunted, and zero children who died before turning five.
The policy challenge
The composition of GHI poses a difficult policy challenge for a country like India. While child mortality is relatively easier to address via public interventions such as local maternity clinics, child wasting, and stunting are harder to address. Researchers have also found an association between economic growth and early childhood undernutrition. In a paper studying the impact of caste discrimination on stunting in India, Rajesh Ramachandran and Ashwini Deshpande write, “There is growing evidence on the impact of early childhood conditions on a variety of later life outcomes, such as health, cognition and mortality (Heck- man, 2007; Case and Paxson, 2010; Currie and Almond, 2011). In particular, stunting is associated with adverse consequences in later life for morbidity and mortality, non-communicable diseases, learning capacity and productivity (Victora et al., 2008; McGovern et al., 2017).”
This makes the GHI picture more concerning for India, since a poor score on child wasting and stunting is not only affecting India’s GHI score and rank but also the children’s later life outcomes.
If you wish to republish this article or use an extract or chart, please read CEDA’s republishing guidelines.


