What data told us about India in 2022
Looking back at the year from the lens of data
2022 was a milestone year for India. It marked the completion of 75 years of Independence from colonial rule and the beginning of India’s journey as a modern democracy. The year saw several significant developments — even though India walked into 2022 with an infectious wave of Covid-19 impacting lakhs of people, the wave receded a few weeks into the year. As hopes for a post-pandemic recovery surged, war in Ukraine brought in new challenges for the global and Indian economy. With supply chains disrupted, global sanctions imposed on Russia, prices of fuel and food shot up. Inflation, already on a high from pent-up demand, shot up.
In this year-end special, we look back at the year from the lens of data. This task is challenging because of the glaring lack of data on many indicators, e.g. changes in consumption expenditure which would allow us to assess, for instance, the changes in poverty incidence. Despite the absence of data on many key indicators, we sifted through several of the available datasets to decipher what they showed us about India in the year. We offer you a peek into how our society and economy was shifting through 2022.
1. Covid-19: The year started with an infectious wave of the Omicron variant of the novel coronavirus with daily recorded cases crossing the 3 lakh mark on more than one occasion in January. However, thanks to the vaccination drive, it was not as deadly as previous waves and soon enough, cases started to decline. In January, India started administering booster doses to a select group of people, and it was made available to the full adult population later in the year. Over 71 percent of Indians were fully vaccinated, and 16.8 percent had received a booster dose as of December 22, 2022, data from Covid-19 Bharat dashboard showed.
In May, the World Health Organisation released its estimates of excess mortality. “Excess mortality”, as the organisation defines it, is “the difference between the total number of deaths that have occurred and the number of deaths that would have been expected in the absence of the pandemic i.e. a no-COVID-19 scenario.” It is a measure of the likely actual death toll of the pandemic, all of which could not be counted by official health systems.
Between 1 January 2020 and 31 December 2021, there were 14.9 million excess deaths, almost 2.8 times the reported covid-19 death count in that period across the world, the WHO estimated. In India, 4.7 million excess deaths were recorded, the highest across the globe and almost ten times the number of deaths (4,81,000) officially attributed to Covid-19 for the same period. Nearly 2.3 million of these deaths happened in just two months of April and May 2021, when the country was in the grip of a fatally infectious wave of the novel coronavirus.
2. Health: The release of the global hunger index in October not only triggered a charged discussion about the right way to measure hunger, it also put the spotlight on the prevalence of hunger and malnutrition in India. The National Family Health Survey-5 data released in its entirety in 2022 offered some clues — as we wrote, the data showed that anaemia, an indicator both of poor nutrition and poor health, is almost a norm in young children in India. Among children aged between 6 to 59 months, 67.1 percent were found to be anaemic, with 35.8 percent being moderately anaemic and 2.1 percent severely anaemic. Among some age groups, an even higher share of babies was anaemic – 75.2 percent of all babies aged 6 to 8 months had some form of anaemia – among babies aged 9 to 11 months, 78.7 percent were anaemic, and among 12 to 17 months, the share was 80 percent.
Over half (57 percent) of women aged 15-49 were also found to have some form of anaemia. Over 28 percent had moderate forms of anaemia and 2.7 percent reported more severe forms. Among men of the same age group, a quarter of those surveyed were found to have some form of anaemia, with a majority reporting milder forms of the condition.
The NFHS data also gave us a glimpse into other important aspects of the health of Indians. 13.5 percent of women surveyed and 15.6 percent of the men surveyed had high or very high levels of blood sugar. Over a fifth of women (21.3 percent) and nearly a quarter of men (24 percent) had elevated blood pressure levels or were taking medicine to control blood pressure.
In over four out of ten households, a member was covered under a health insurance/financing scheme, found the NFHS-5, up from 28.7 percent as found by the NFHS-4. In a CEDA article, we noted the high costs of institutional deliveries , particularly in private hospitals in India. The per capita expenditure on health (at constant prices) was Rs 3,314 as of 2018-19, data released by the National Health Accounts Estimates showed. While the share of government spending in India’s Total Health Expenditure (THE) has been increasing, a large share of healthcare expenditure continues to be borne by households – nearly half (48.2 percent) of India’s THE is borne out of pocket by households, the NHA data showed.
3. Education: Lockdowns to contain the spread of Covid-19 impacted millions of children through much of 2020 and 2021. While schools had started reopening intermittently in 2021, it was only this year that schools across the country opened up fully and welcomed children back to classrooms. When they did so, they were not simply picking up where they had left in 2020: they were on a backfoot.
There had been concerns about the impact of school closures on learning outcomes right from the early days of the pandemic. In May 2022, findings of the government’s National Achievement Survey (NAS) 2021 were released. The previous round of the survey was conducted in 2017, on the other side of the pandemic.
The survey is a national-level large-scale assessment tool. It tests students of classes 3, 5, 8 and 10 on their learning outcomes related to language, mathematics, environmental studies (classes 3 and 5), language, mathematics, science and social science for class 8 and modern Indian language, mathematics, science, social science and English for class 10.
Compared to the scores from 2017, NAS 2021 reported lower mean scores for students across grades and subjects. Almost a quarter of surveyed students (24 percent) said they did not have a digital device at home, 38 percent said they faced difficulty in learning at home during the pandemic and 78 percent said they found learning at home burdensome.
The survey also found a decline in the learning outcomes of students for older students. While the average score for mathematics was 306 on 500 (61.2 percent) for grade 3, the corresponding scores for grades 5, 8 and 10 were 284, 255, and 220 respectively. The trends were similar for other subjects as well.
Another survey released in 2022 highlighted the huge learning losses of the pandemic years. In the survey conducted in schools of Jharkhand by a civil society organisation , a large share of teachers reported that many students of grades 3-5 had almost forgotten to read and write by the time they were back to the classroom in 2022 (Gloom in the classroom, Gyan Vigyan Samiti Jharkhand, 2022).
4. Demographic shifts: Even as India’s population rises, the growth rate has been slowing down. Data from both the Sample Registration System (SRS) and the National Family Health Survey-5 reveal a decline in India’s total fertility rate (TFR), i.e. the average number of children born to a woman. The NFHS-5 pegs the TFR to be 2.0 for 2019-21, and the SRS also pegged it at 2.0 for 2020 below the replacement level of 2.1, indicating a slowdown of population growth. But wide inter-regional variations remain. The TFR for urban India was 1.6 in 2020, the SRS data showed, while for rural India it was 2.2.
Even as the TFR was much below replacement levels in several states, Bihar, Uttar Pradesh and Madhya Pradesh will continue to drive population growth – the TFRs in the states were 3.1, 2.9 and 2.7 respectively in 2020.
On November 15, the world population hit the 8 billion mark. With a population of 1.4 billion people, India accounts for 17.5 percent of the global population. India will also surpass China in 2023 and will have the largest population.
5. Gender equality: The SRS data released by the Office of the Registrar General & Census Commissioner showed some encouraging progress on gender equality. India is making progress on addressing a profound form of gender-based violence – its notoriously low sex ratio at birth (SRB). The SRB at the national level has improved in recent years, the SRS data showed – for every 1,000 boys born in the country in the period 2018-20, 907 girls were born, the data shows. This is up from 876 in 2005 and 898 in 2014-16.
However, beyond the headline national numbers, a more complex story seems to be unfolding at the state level, our ‘Picture This’ on this subject pointed out. Since 2014-16, several states have made considerable progress on this front. These include states such as Rajasthan and Haryana, which have some of the most skewed sex ratios in the country. However, on the other hand, nine states have seen a worsening of the SRB at birth.
Urban and rural India also seem to be moving differently – while rural India’s SRB was better than urban India’s just a few years ago, this trend has now reversed. From 888 in 2013-15, urban India’s SRB rose to 910 by 2018-20. In rural India, on the other hand, the SRB improved from 902 in 2014-16 to just 907 in 2018-20.
The SRS data also showed that the gender gap on infant mortality had been closed. However, the under-5 mortality rate continues to be higher for girls (33) as compared to that for boys (31) with a wider gender gap in rural areas than urban ones.
6. Employment: Jobs and employment have been a persistent concern for the country in recent years, and the Covid-19 pandemic had resulted in acute job losses. The impact of the pandemic on employment was particularly harsher on women, and this has lingered on even in 2022.
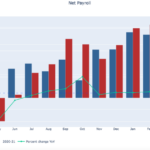
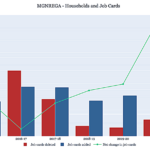
Even as employment has recovered from the initial shock of the lockdowns brought in to check the spread of Covid-19, the recovery isn’t complete, data from the Centre for Monitoring Indian Economy’s household surveys shows. Compared to January 2020, almost 14 million fewer individuals were employed in October 2022 — 4.5 million fewer men and 9.6 million fewer women.
The government’s Periodic Labour Force Survey (PLFS) data also reveals a similar gendered trend. India had an Unemployment Rate (UR) of 7.8 percent, based on current weekly status in urban areas for people aged 15 and above in the October-December quarter of 2019 before the pandemic hit. For men, this was 7.3 percent while the UR for women was 9.8 percent. After hitting 20.8 percent during April-June 2020, UR stood at 7.2 percent in the July-September quarter of 2022. For men, it stood at 6.6 percent, while for women it was 9.4 percent.
7. Poverty and inequality: In its global Multidimensional Poverty Index for 2022, the UNDP noted that 415 million people had exited poverty in India in the past 15 years. However, the UNDP report was unable to estimate the impact of the pandemic since a large part of the data it used to arrive at its calculations – the NFHS – was collected pre-2020. But another data report published by the World Bank tried to answer that question.
Covid-19 interrupted the global pursuit of poverty reduction, said the report, ‘Poverty and Shared Prosperity 2022, released in October. For the first time in more than two decades, the share of people living in extreme poverty increased in 2020, marking a departure in an ongoing trend of poverty reduction, the report said. The pandemic pushed an additional 70 million people into extreme poverty. As a consequence, 719 million were living in extreme poverty around the world in 2020.
In the absence of updated government data on poverty, the report used an analysis by Sinha Roy and van der Weide (2022), who used data from the Centre for Monitoring Indian Economy (CMIE) to estimate that anywhere between 23-56 million people were pushed into poverty in India during 2020. That would mean anywhere between 33 and 80 percent of those who were pushed into poverty around the world were in India.
The World Bank report also highlighted growing inequality in the post-pandemic world. Income losses of the poorest 40 percent of the world’s population were twice as high as those of the richest 20 percent, the report said. In India too, inequality has been a real concern. Sectors that cater to richer households in India have seen a stronger recovery as compared to those that cater to relatively poorer households, with automobile sales being a good example. High-priced cars have seen higher sales in the current fiscal, even higher than their pre-pandemic sales, while sales of lower-priced cars and two-wheelers haven’t picked up, so much so that many car manufacturers have cut down operations of lower-priced models.
8. Inflation: As economic recovery started to pick up in 2021, inflation started climbing up in several major economies. This was attributed to pent-up demand as covid-19 vaccinations helped consumption recovery rapidly. While the problem was not as big in India as it was in the West, inflation had still breached the 4% medium-term target that the Reserve Bank of India operates with. It didn’t prove to be enough for the central bank to tighten its ultra-loose monetary policy, in the hope that this was a temporary phenomenon.
But just weeks into 2022, Russia’s attack on Ukraine disrupted the global economy. Supply chains were hit, prices of crude oil shot up. Inflation in India grew further, hitting the 6.95% mark in March and 7.79% in April, an eight-year high. Food prices were especially impacted with their inflation crossing the 8 percent mark in April 2022.
In May, in an unscheduled meeting, the RBI acknowledged the challenge, and finally hiked the repo rate by 40 basis points, and followed up with further hikes in the month after. Inflation kept rising and appeared to have peaked in September when it hit the 7.41% mark (with food inflation as high as 8.6 percent). The year is ending on a more encouraging note — retail inflation had cooled to 5.88 percent by November, an 11-month low.
If you wish to republish this article or use an extract or chart, please read CEDA’s republishing guidelines.
